
Using Microsoft's new Code editor as Node debugger (on a Mac)
Visual Studio Code was just launched. I was wondering outloud in the twittersphere about why would I choose over Atom Editor (since it is directly based on many of the same technologies and concepts) and I got a response from a PM at Microsoft. After quickly reading the docs referenced, I got started. I wanted to try the integrated debugger on a Node app I am working on.
I was able to attach to a node debugger process that Grunt was already spawning.
What other steps did I need on my Mac?
I followed the basic debug instructions to configure Code’s debugger. Since I was going to be attaching to a debugger process, I didn’t really need to configure the ‘Launch’ task. OK, let’s save the settings file and start the debugger.
The first time I tried to run, I encountered an error: “Cannot start OpenDebug because Mono … is required.”

No problem. I use Homebrew on my Mac running OS X Yosemite, and it has a recent version available.
brew install mono
Time to re-launch and try again.

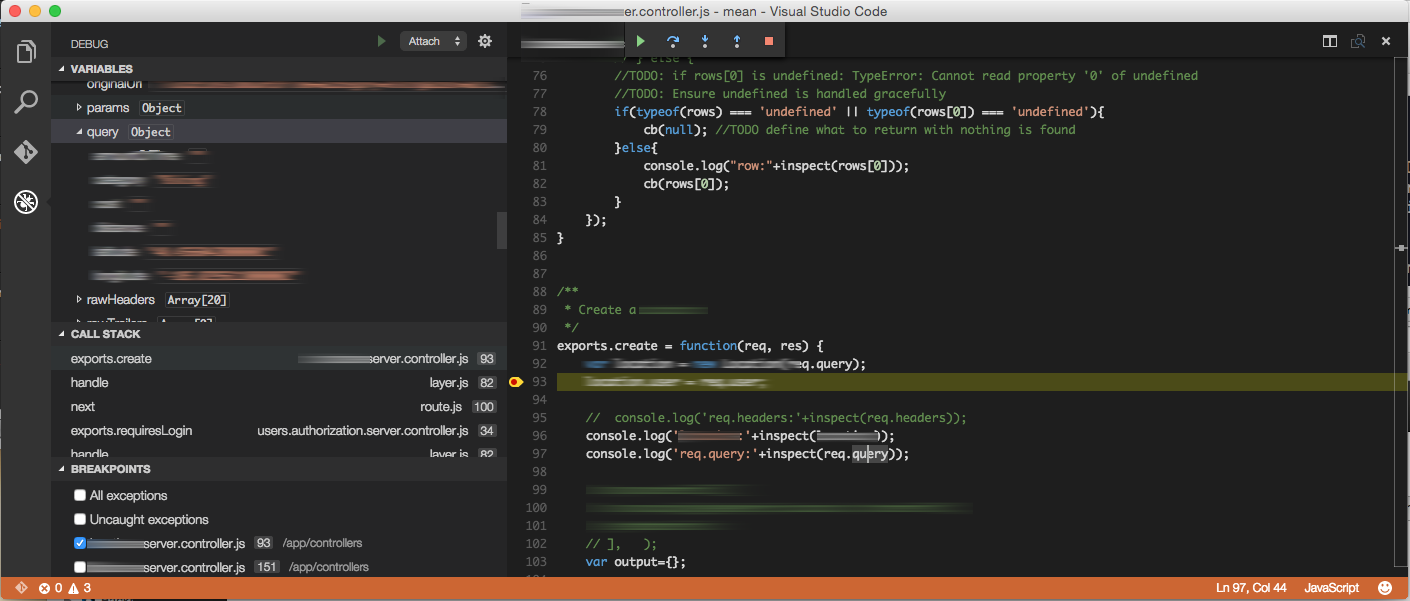
Strange. I shouldn’t need to (re)-launch node in debug mode… Oh, whoops. Forgot to select the [Attach] configuration…. OK. That’s done. Now, let’s just set a breakpoint… BINGO.
Summary
Some of this is quite new and rough (if you believe all the caveats), but I found it to be very functional for my needs. Node debugging support is built-in.
There are many other browser-based debuggers out there to choose from. And I use Emacs as my preferred editor with some forays onto Atom Editor, so I am not sure whether I will stay with VSCode, but it is a promising launch. And it is nice to know that it is around and will be improving with the times…