
Fancy Home Assistant Weather Cards and Dashboard
I recently got a local outdoor weather station and used it a reason to add more weather data to my Home Assistant setup.

EcoWitt WS90 and GW3000
I ordered an EcoWitt “Wittboy” kit during the recent holiday deals. It consists of an outdoor solar-powered weather sensor array, and a networked indoor hub. It is the US version, which uses 915 MHz telemetry.
I created a 3D printed “adapter” for fixing onto a birdhouse pole, making available on Printables: Ecowitt WittBoy WS90 Weather Station Sensor Array Birdhouse Pole Stand Adapter.
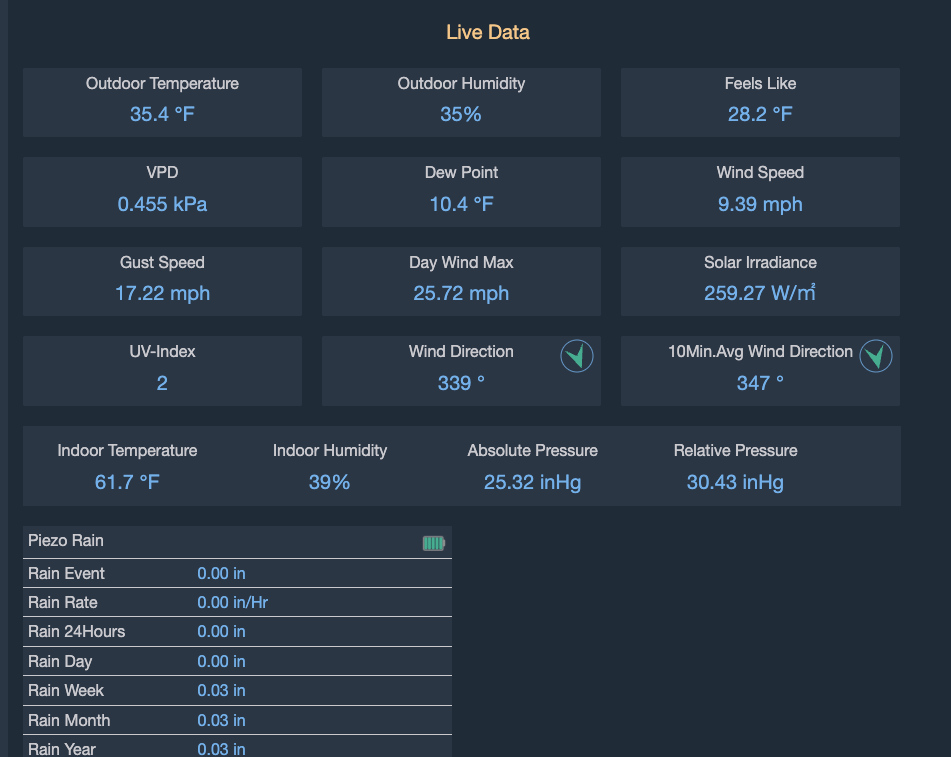
The way these weather stations work is that they periodically transmit sensor readings and then the hub receives these broadcasts and logs the data according to how it has been configured.
Home Assistant Basics
I use Home Assistant OS on a Raspberry Pi 5. I have been using it since even before the Pi 5 was officially supported, and run it on an NVMe SSD drive. It comes with weather forecast support. There seems to be all manner of weather dashboard integrations, but I came across some now-lost Reddit threads which rolled their own weather dashboard views, and I ended up adopting/adapting this approach.
I’ve link to a version of my Card and Dashboard views below.
Hass Integrations
There were numerous integrations used to achieve the deshboard views. They are all available via HACS if they are not already included in the officially included ones.
Hass Integrations - Data
Data
- Ecowitt official - local API webhook
- Ecowitt
- Pirate Weather
Hass Integrations - Views
For Charts
- Apex Charts
- Lovelace Layout Card
- Plotly Graph Card
Ecowitt weather station
There are two options that both work: the “Official Integration” which is not the same as the listed Ecowitt integration.
- “Official Integration” Ecowitt/ha-ecowitt-iot: This integration uses the locally available http APIs to obtain data from the supported devices inside the local network.
- Listed in Home Assistant directory: Ecowitt - Home Assistant
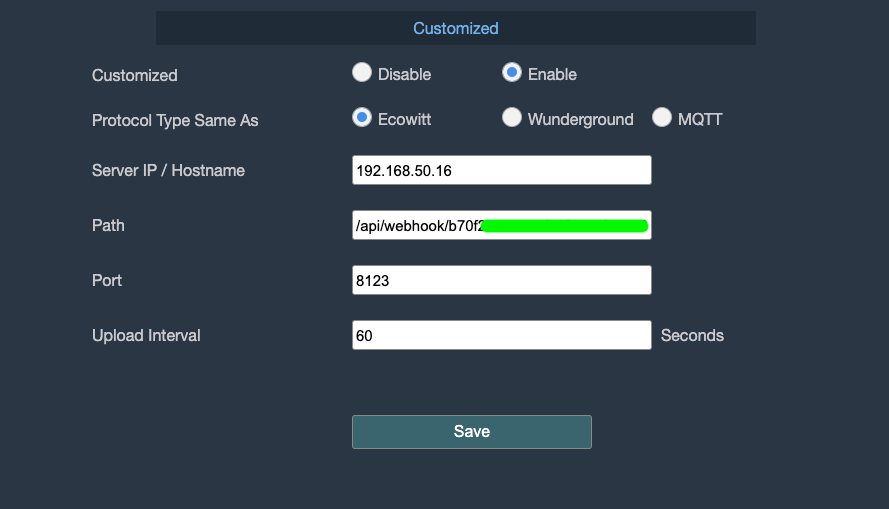
The former “Official” Ecowitt integration is a local-only API that will create a webhook with its integration. Part of setting it up means configuring the webhook key / URL in the network hub settings.
The latter one using the built-in cloud data logging from the Ecowitt hub (if you have it enabled). Their cloud service keeps a history of readings. I switched from this to the local-only integration after I installed a micro-SD in my network hub.
They both expose the readings as entities (some slight variations in naming) for the device.
Pirate Weather
Pirate Weather is a weather forecast system with an API similar to the no-longer-available Dark Sky one.
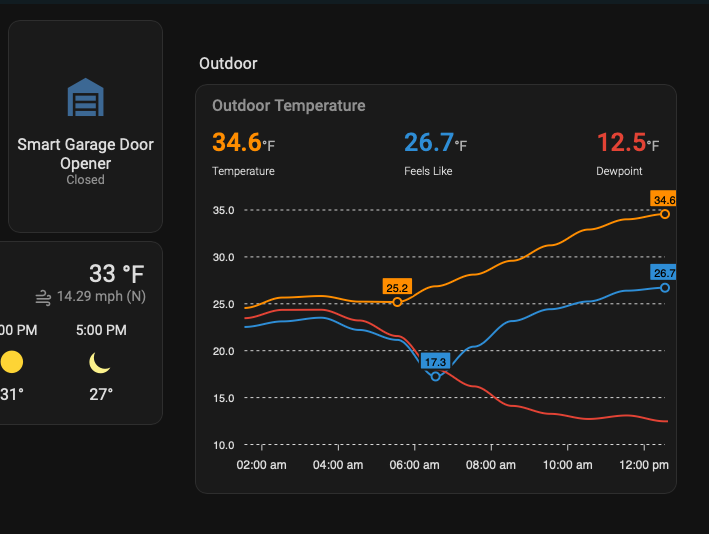
I use it to include weather forecasts. There are all sorts of weather cards and data sources for forecasting. Plenty of easy experimentation to find something you like.
Apex Charts
Lovelace Layout Card
thomasloven/lovelace-layout-card: 🔹 Get more control over the placement of lovelace cards.
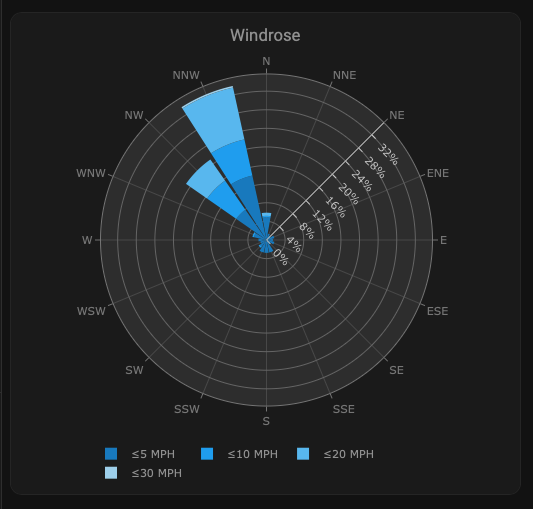
Plotly Graph Card
Used in the “Wind Rose” chart.
Sensor Card
There are other weather card views available, but I used the apex chart view. The view is configured manually using YAML.
Weather Dashboard
The entire dashboard is configured through YAML. I found it easiest to edit the YAML in Visual Studio Code, and then copy and paste the whole file, replacing the entire contents of the configuration
It has been split in two parts: the “root” which basically contains templates and DRY default configs for the charts.
Here is the whole dashboard expressed in YAML.