pitempmon Charts
I created some client-loaded charts for pitempmon project that graph the logged temperature of a Raspberry Pi Model 4 B. The Pi is used as a worker node in a kubernetes cluster. There is an interesting progression over time of Pi environmental temperature aspects.
The pitempmon project logs a Pi’s CPU temperature data to a self-hosted phant data logging service. In this example, the phant webservice is running as a pod in kubernetes cluster on the very same Pi that is being monitored.
Three month tour
pitempmon has been installed on a Raspberry Pi Model 4 B for a while now. Since it has been operational it has had a small metal heatsink stuck on the CPU package. The Pi has been part of a kubernetes cluster serving websites, including the phant server, and running other things like a traefik ingress.
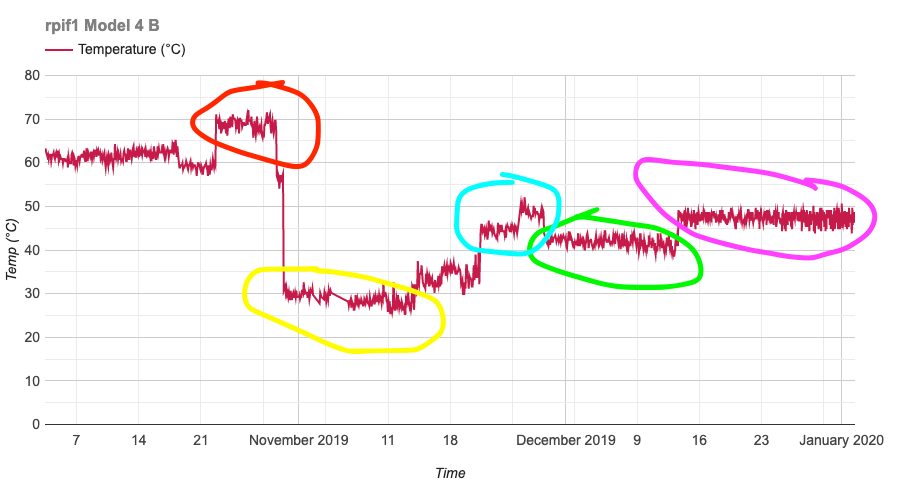
Here is a saved chart of the temperature over the last three months:

There are five regions in the above chart annotated here:
- red: ~70°C Running in cluster, before firmware update that drastically reduced Pi 4 CPU temp.
-
yellow: ~30°C Running in cluster, after firmware update and with 5V PiFan (over heatsink)
- the firmware update was a huge improvement on its own! the always-on fan increased cooling even more
- cyan: 45-50°C Fan was running noisy and intermittently failing to sustain itself, so was removed
- green: 40-45°C Took out of 3d printed case and placed PCB vertically.
- magenta: 47-50°C Changed power supply to a PoE HAT (its fan turns itself on at ~50°C)
Some observations.
The Pi 4 would throttle itself at 70°C (red) as a kubernetes worker node (before the firmware updates)
The PiFan active fan (yellow) turned out to be overkill. Since it was installed within a day of the firmware updates, it registers as around a 40 degree delta over pre-firmware update temperatures,
Turning the bare Pi on its side (green) had a real and noticeable affect. That pearl of wisdom came near the end of this post on Pi 4 thermal testing on the offical blog (heading “Keep cool with Raspberry Pi 4 orientation”). The post also discusses other related temperature findings, and is an interesting read.
Adding the PoE (Power over Ethernet) HAT (magenta) seemed to partially negate the Pi orientation benefit.
Live charts hosted in a GitHub project
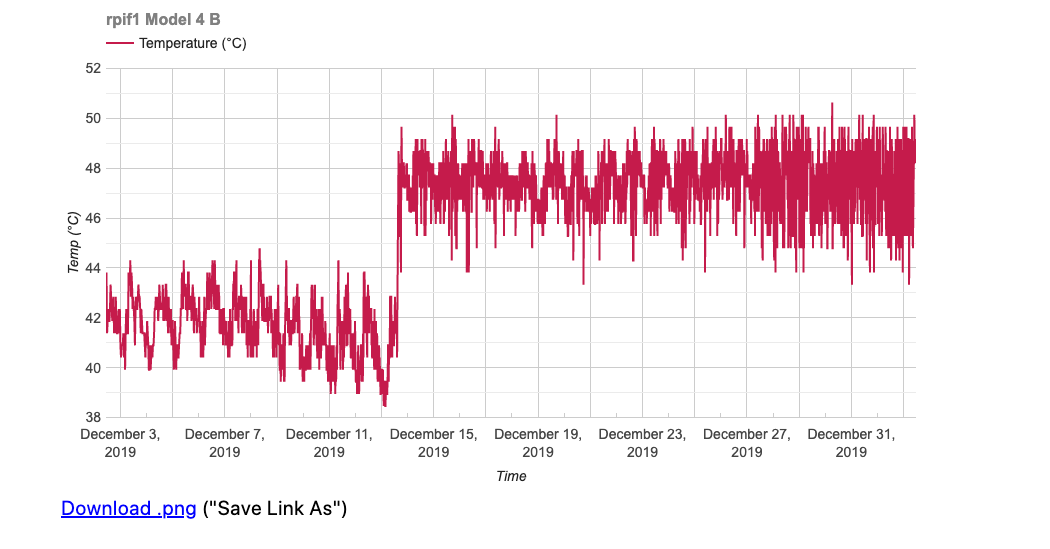
A “live” version equivalent to the following screengrab below can be visited at Monthly rpif1 Temperature.
There are other time windows available there. The data is loaded live in your webbrowser client each time the pages are loaded.

Notes on PoE HAT
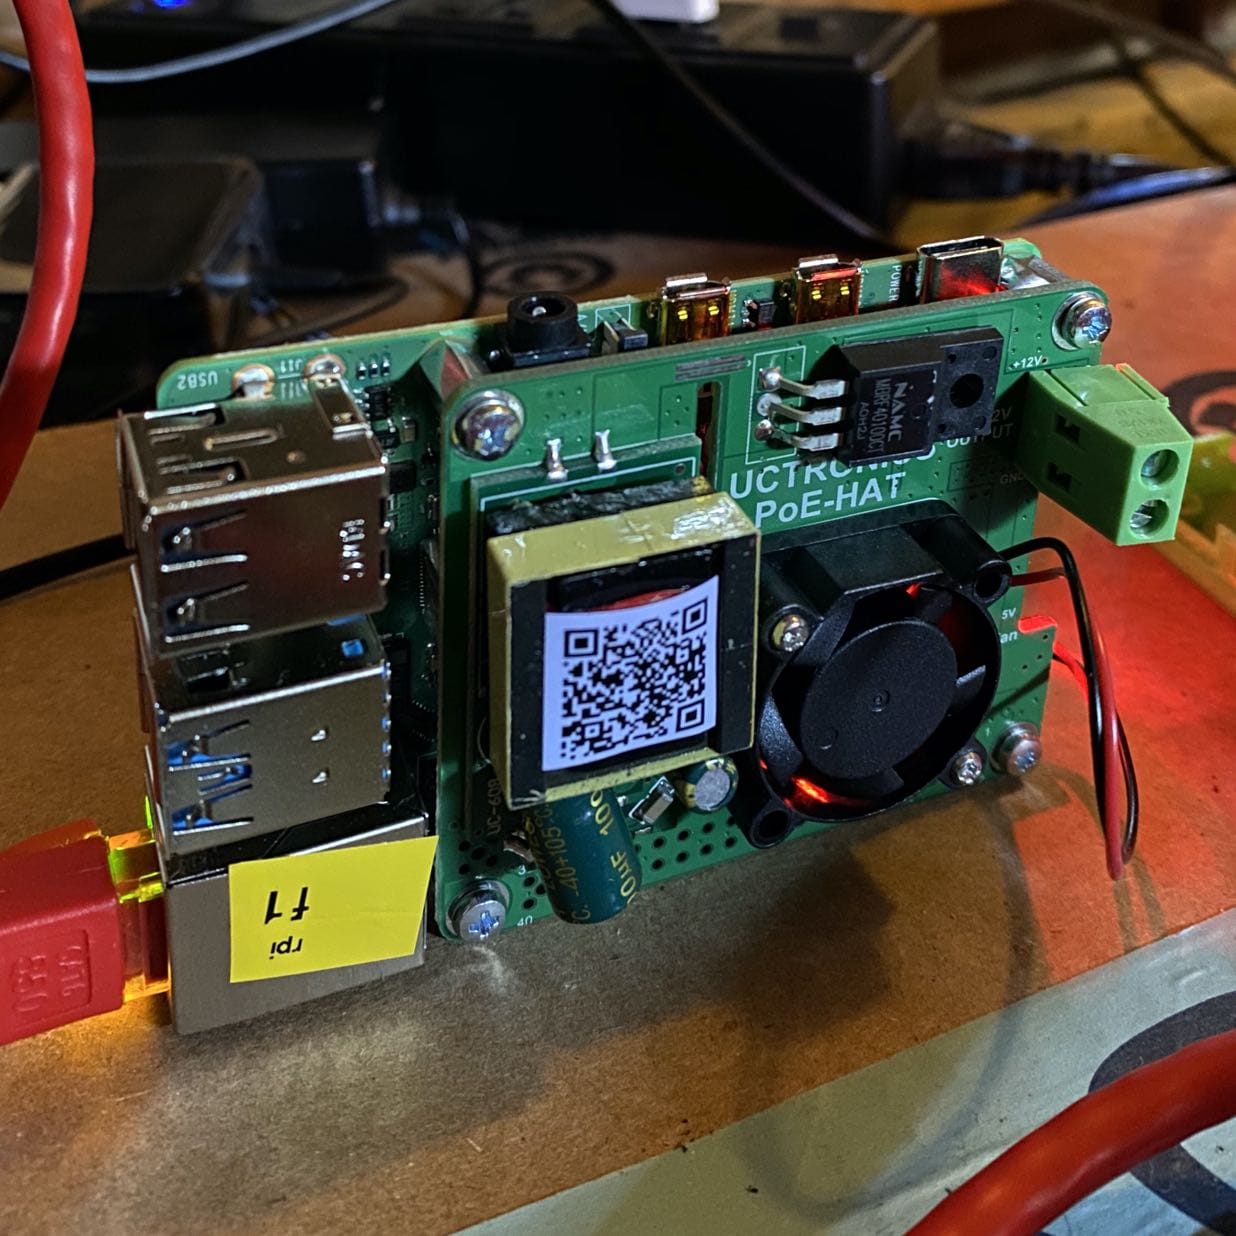
Since the ambient air no longer has unimpeded access to top of Pi, there is less convection of surrounding air. The PoE PCB blocks airflow with its footprint, and devices on it (e.g., DC-DC voltage converters) produce heat of their own. However, the PoE HAT’s built-in fan positioned directly over the SoC keeps the sustained CPU SoC temperature under 50°C.
I think PoE HAT has a thermostat action in its kernel overlay that kicks on the fan around that 50°C point, as its fan rarely turns itself on.
Photo of Pi with PoE HAT

Must affirm third-party consent for Disqus comments to appear.